Road safety is not only determined by the technology of the vehicles on the road, but rather a significant aspect of safety lies in the interaction between the vehicles and other vulnerable road users (VRUs), namely pedestrians and bicyclists. It is crucial to assess VRUs’ patterns of perception and reaction in certain contextual settings to enhance the safety of the whole traffic system. The purpose of this research is to gain an understanding of perceived safety and technological acceptance as it relates to bicyclists, pedestrians, and the road environment. To verify the findings in VR experiment, we also conduct real road test to benchmark our findings from different sensors. This information can be used by planners and engineers to better design technology and infrastructure for bicyclists and pedestrians. Furthermore, we propose to integrate the findings of these experimental studies into driving simulations to increase the awareness of future autonomous vehicles on varying behaviors of VRUs within different contextual settings.
SUMMARY
Safety Research of Vulnerable Road Users (VRUs) - VR application in Transportation and Real Road Tesing
To support this research as well as other research projects utilizing VR/AR technologies, in collaboration with Dr. Donna Chen, Austin Angulo and Erin Roberts, we have established the Omni-Reality and Cognition Lab (ORCL), in order to support research studies related to understanding the impact of alternative design solutions on human behavior, psychophysiology, and decision making. This lab is setup to further support VR/AR research studies by other faculty in the Department of Engineering Systems and Environment.
VR application in Transportation
Systems Setup
Advances in VR technology have presented new opportunities for research in areas that are dangerous, difficult, or expensive to conduct naturalistic studies, especially for VRUs. In this study, we have set up a cycling/pedestrian simulator using HTC VIVE PRO EYE head-mounted display (HMD), wearable devices, and physical bicycle to increase participants’ sense of immersion, all integrated through the Unity game engine.
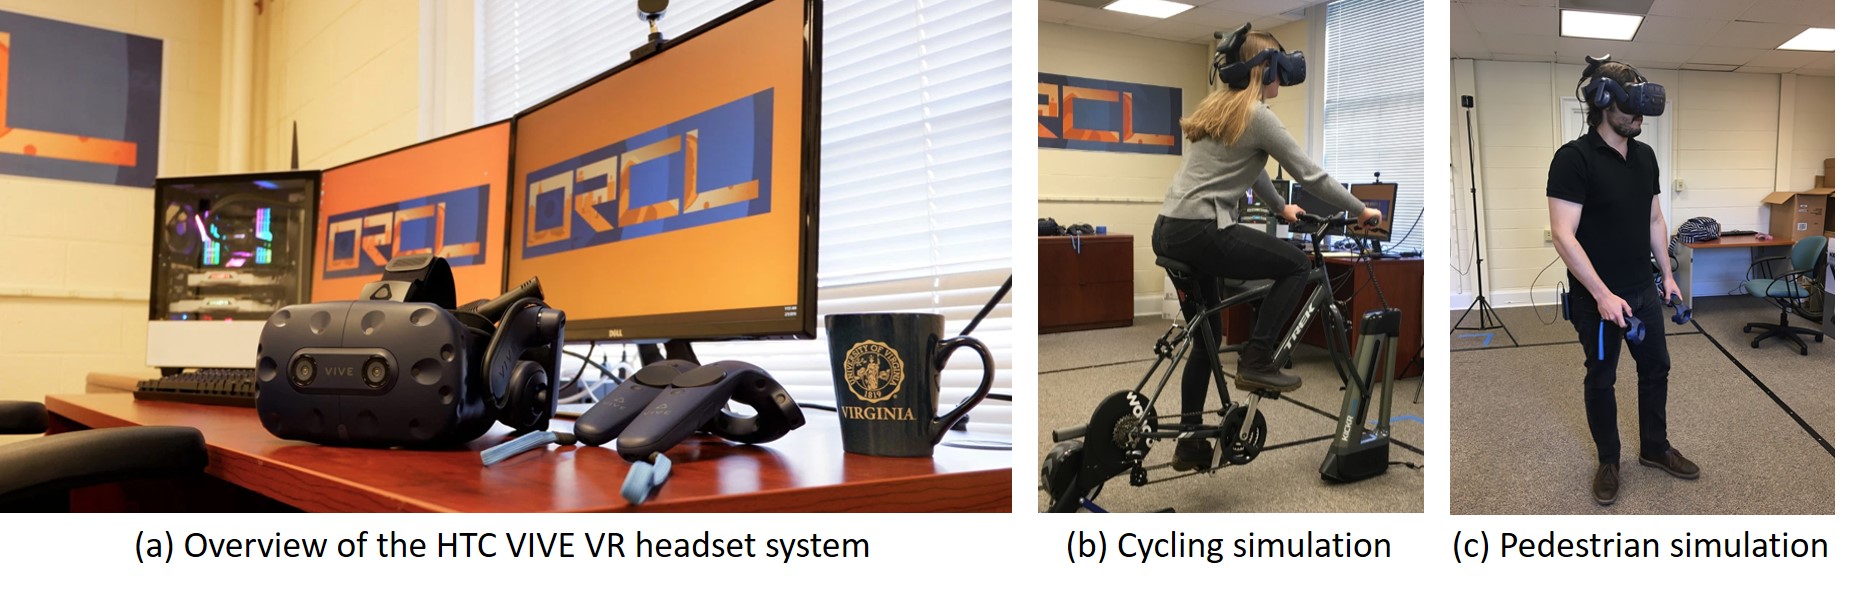
The environment we have created is called water street – a downtown area in the city of Charlottesville, which is local accident-prone area for VRUs. As is shown in the following figure, we are able to build a high-fidality simulation for this environment.

Data Collection & Analysis
We collect data from 4 major sources: (1) Unity for movement and user input of bicyclists and pedestrians; (2) Tobii Pro SDK for eye tracking; (3) Vehicle dynamics data from AirSim; (4) Smart Watch for physiological data. Sample code for data collecting and analysis is available on Github.
With the C# script attached to the scenario in Unity, we are able to extract the 3-D position of any objects in the scenario per frame during running. Any input to the controllers will be recorded to retrieve the manipulation information of bicyclists or pedestrians.
The eye tracking features of HTC VIVE Eye Pro in Unity comes from integrated Tobii Pro eye tracker. It can be utilized to track and analyze eye movement, attention and focus for deeper data analysis. By designing interactions with other objects, it can help to create more immersive virtual simulations, gain insights about user performance and improve training scenarios. With the Tobii Pro Unity SDK, raw gaze data which indictes where the users are looking can be outputed. To map the gaze direction from the raw gaze data, we use the Unity Recorder to record the VR users’ view, then map the raw gaze to the videos.

AirSim from Microsoft is implemented into our scenario for the study of VRUs’ interaction with vehicles. AirSim is a open-source, cross platform simulator for drones, cars and more, built on Unreal Engine (we now also have an experimental Unity release). AirSim support both manual control (keyboard or remote control by driving suits) or programmatic control (Conditional control or automated control by different APIs such as Python/C++). Data output includes: 1) vehicle dynamics such as speed, throttle, brake and gear; 2) Various types of images from the camera in the car like normal RGB images, depth images and semantic segmentation images.

Our platform uses an android smartwatch that is equipped with “SWEAR”, an in-house designed app for collecting long-term data from smartwatches. This app is designed by Professor Boukhechba, who is also one of the LinkLab members . SWEAR smooths the data collection by adding the ability of changing each sensor’s data collection frequency to the desired frequency. SWEAR records heartrate , hand acceleration, audio amplitude (noise level), light intensity, location, and gyroscope. Each one of these time-series are important in retreiving valuable insight about the VRUs and the environment. For instance we retrieve root mean squared of the successive R-R intervals (RMSSD) of the driver under different environmental conditions. It has been shown that lower RMSSD can be an indication of higher stress level.

The following two videos show the view of bicyclists inside/outside the VR scene.
For the pedestrians, we support both walking on the floor (short path) and by controllers (long path). By programing on the controllers, we can also generate interactive behavior with the environments such as the pedestrian crossing signs.
The following video shows how we map the gaze behvior in the VR recordings.
Real Road Testing
Systems Setup
To validate findings in VR simulators, we also conduct real road experiment in the same scenario.
Data Collection & Analysis
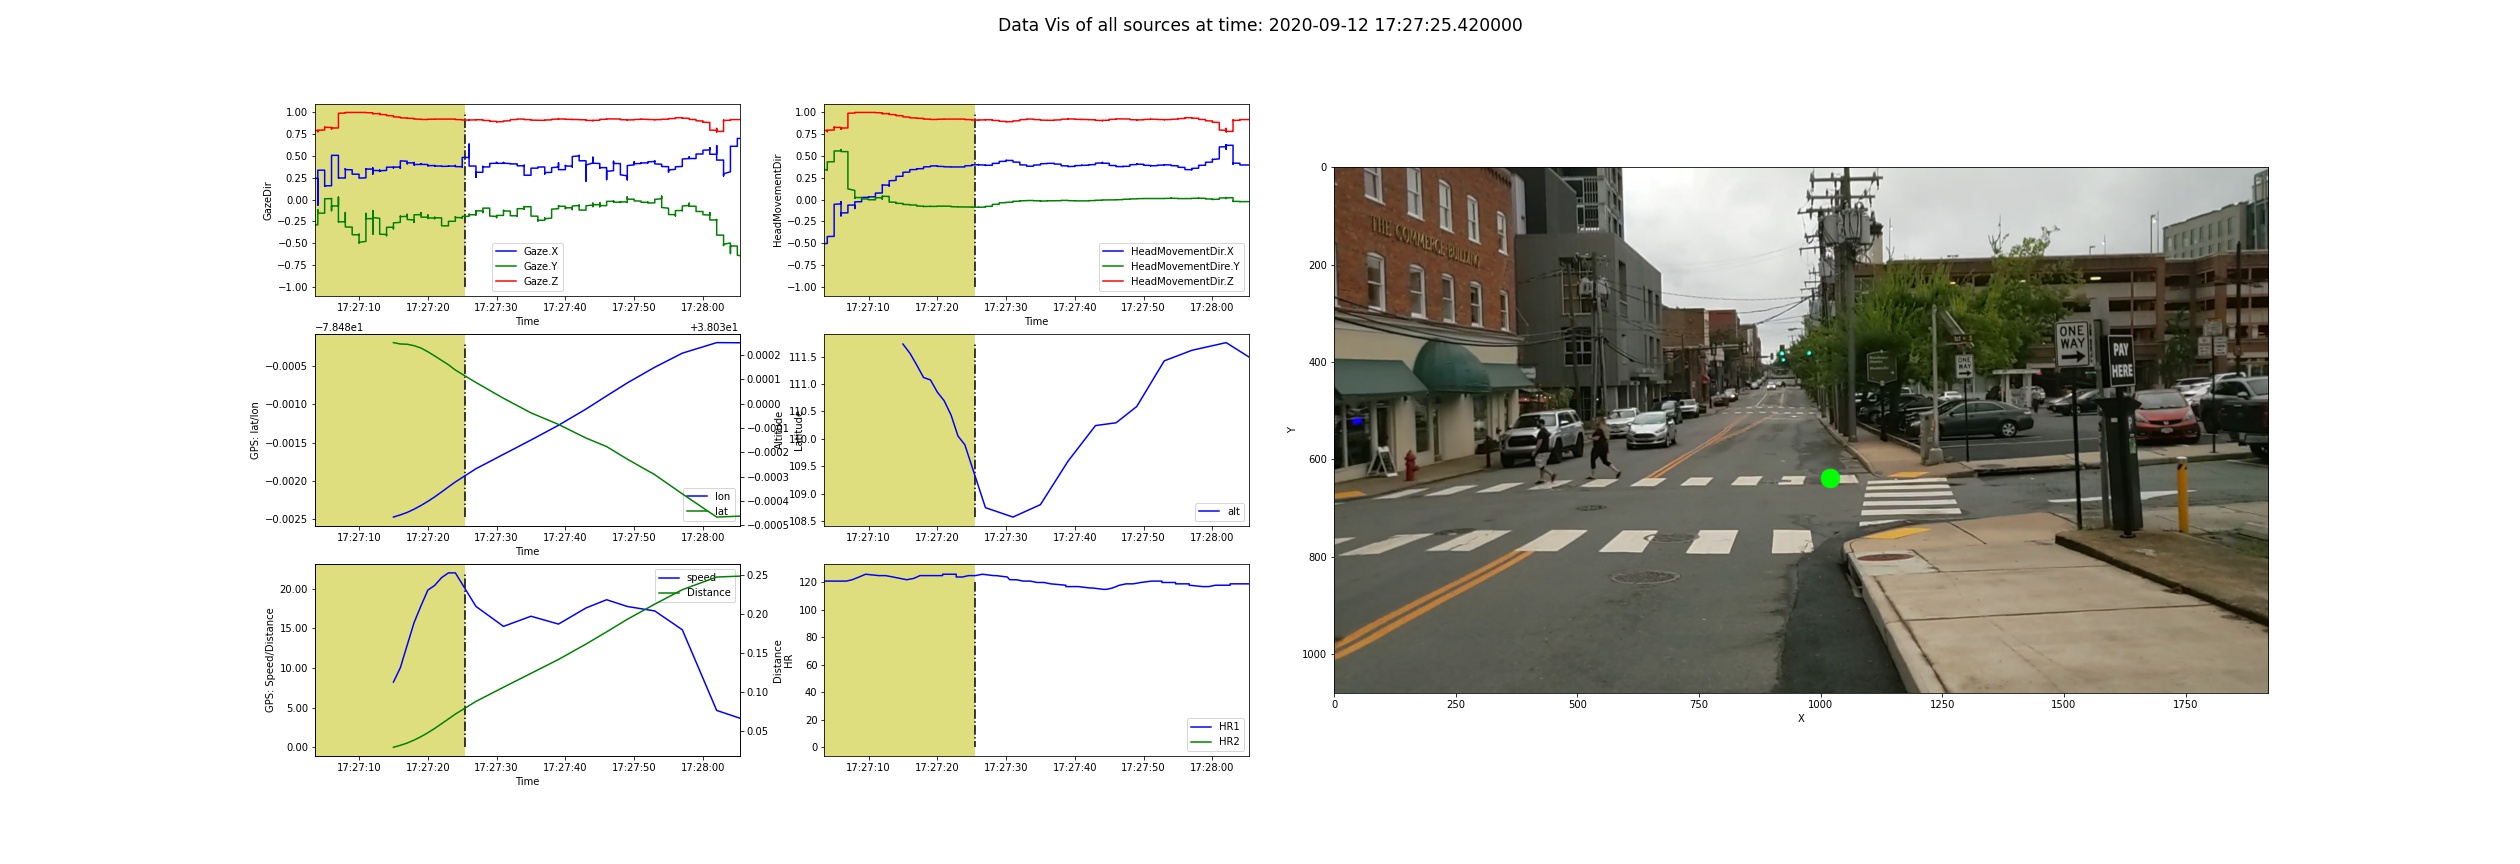
We collect data from 3 major sources: (1) GPS from smartwatch for movement of bicyclists and pedestrians; (2) HoloLens2 for eye tracking and head movement; (3) Smart Watch for physiological data and hand movement. We extract GPS data from the same smartphone app, which can provide the location, speed and elevation information. The eye tracking features are from HoloLens2, which also supports eye tracking data collection and interactive design. All the raw data needs to be synchronized for further analysis.
The figure below shows how the time synchronization and data visualization works across different data sources.
The video below shows how we map the gaze behvior in the real road recordings.
Presentations
The video below is our presentation in Transportation Research Board 100th Annual Meeting – 1420 – Visualization in Transportation Lightning Talks.
Publications
Team Members

Arsalan Heydarian
Principal Investigator

Xiang Guo
Graduate Research Assistant